Rental costs across the US continue to increase rapidly. The national median rent rose by 17.6% in 2021, the highest annual increase in over 50 years.
Meanwhile, wage growth averaged only 4.5% in the same period. This widening gap makes housing affordability a growing concern for many Americans.
30% Income Rule: Outdated Standard?

Financial experts have long recommended spending no more than 30% of income on housing. This guideline originated from the United States National Housing Act of 1937.
However, current economic conditions make this standard increasingly difficult to achieve. In 2021, 46% of American renters spent over 30% of their income on rent.
National Housing Wage Hits $28.58

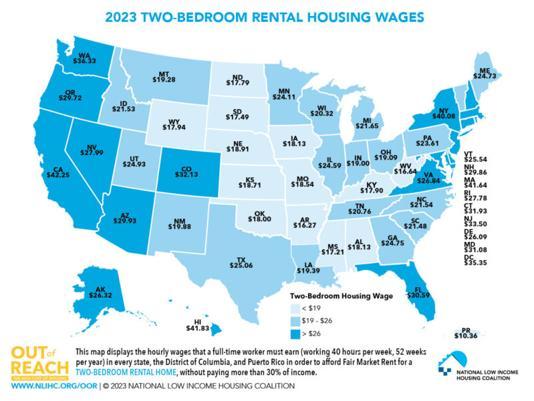
The National Low Income Housing Coalition calculates the Housing Wage annually. For 2023, the national Housing Wage reached $28.58 per hour for a two-bedroom rental.
This figure represents a 7.4% increase from 2022. The Housing Wage varies significantly by state and metropolitan area.
California Tops Housing Wage List

California requires the highest Housing Wage at $42.25 per hour. This equates to an annual income of $87,880 for a 40-hour work week.
San Francisco demands the highest metropolitan Housing Wage at $73.29 per hour. These high wages reflect California’s severe housing shortage and high cost of living.
Arkansas: Most Affordable Rental State

Arkansas has the lowest Housing Wage at $16.27 per hour. This translates to an annual income of $33,841 for full-time workers.
Fort Smith, Arkansas, offers the lowest metropolitan Housing Wage at $15.25 per hour. These lower wages reflect Arkansas’s lower cost of living and less competitive housing market.
Minimum Wage Gap Widens

The federal minimum wage remains at $7.25 per hour, unchanged since 2009. This rate falls short of the Housing Wage in all 50 states.
Minimum wage workers need to work 79 hours per week to afford a one-bedroom rental at national average fair market rent. This gap highlights the growing disconnect between wages and housing costs.
Affordable Housing Shortage Persists

The US faces a severe shortage of affordable rental units. Only 34 affordable units exist for every 100 extremely low-income renters.
This shortage affects approximately 10.8 million renter households. The deficit of affordable units has grown by 3.7 million since 2007.
State-by-State Housing Wage Variations

Housing Wages vary dramatically across states. The top five highest Housing Wages are in coastal states with large urban centers.
Rural states generally have lower Housing Wages. These variations reflect differences in local economies, housing markets, and policies.
Working Hours for Minimum Wage Earners

Minimum wage workers face extreme challenges in affording rent. In Hawaii, they must work 107 hours weekly for a one-bedroom apartment.
New York and Massachusetts require over 90 hours per week. These figures illustrate the severe mismatch between minimum wage and housing costs in high-cost areas.
Historical Context of Housing Affordability

Housing affordability has worsened over the past decades. In 1960, the median renter spent 19% of income on rent.
By 2020, this figure rose to 31%. The share of cost-burdened renters (spending over 30% on rent) increased from 24% in 1960 to 46% in 2020.

